

UNS Global understands that sewage treatment plants can seem complex at first glance, especially when people look at technical drawings and process charts. We provide complete sewage treatment solutions backed by clear documentation and user-friendly diagrams. We ensure that clients fully understand how their systems work, making operations smoother and more reliable. A clear flow diagram simplifies the entire treatment journey, from raw sewage entering the plant to clean, reusable water leaving it. Whether it is a small plant or a large industrial setup, UNS Global integrates well-structured flow diagrams into every project.
Sewage Treatment Plant Diagram
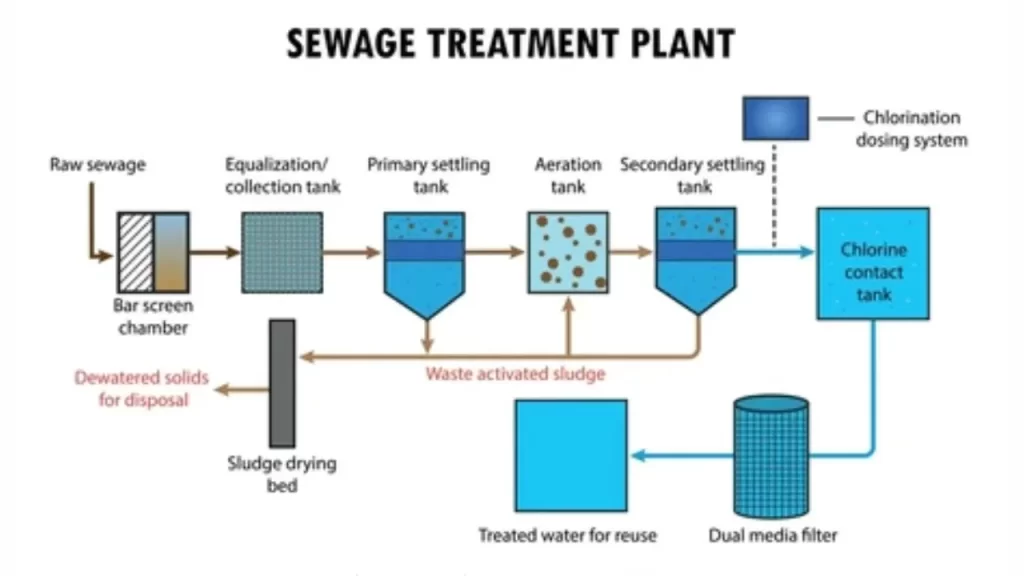
A standard diagram of a sewage treatment plant usually begins with the inlet chamber and ends at treated water discharge or reuse. Between these two points, wastewater passes through several critical stages. Each stage has a specific role in removing solids, organic matter, and harmful microorganisms.
An easy sewage treatment plant diagram often highlights three main phases:
- Preliminary Treatment
- Primary Treatment
- Secondary and Tertiary Treatment
This simplified structure makes it easier to understand even for first-time viewers.
Importance of Flow Diagrams in STP
- Clear Process Understanding: Flow diagrams help explain the complete sewage treatment process in a simple visual format, making it easy to understand how wastewater moves through each stage.
- Operational Efficiency: Operators can quickly identify each treatment unit and its function, which helps in smooth day-to-day plant operations.
- Easy Troubleshooting: When any issue occurs, flow diagrams allow technicians to trace the problem area faster and take corrective action.
- Better Training Tool: New staff and technicians can learn STP operations more effectively with the help of clear and structured flow diagrams.
- Improved Planning and Design: Engineers use flow diagrams to plan upgrades, expansions, and modifications without disturbing existing processes.
Also Read : 10 Modern Swimming Pool Designs to Transform Your Backyard
Step-by-Step Explanation of the Sewage Treatment Flow
- Inlet and Preliminary Treatment: The flow starts when raw sewage enters the plant through inlet pipes. Bar screens remove large objects like plastic, cloth, and debris. In a waste water treatment plant diagram, this stage is usually shown at the very beginning because it protects downstream equipment from damage.
- Primary Treatment Stage: A clear flowchart sewage treatment plant process shows this separation clearly, helping operators understand how physical treatment reduces the load on biological systems.
- Secondary (Biological) Treatment: This is the heart of the sewage treatment process. In aeration tanks, microorganisms break down organic matter in the presence of oxygen. A sewage treatment plant diagram typically uses arrows and labels to show air supply, mixing, and microbial action. This stage significantly reduces BOD (Biochemical Oxygen Demand) and COD (Chemical Oxygen Demand).
- Secondary Clarifier: After biological treatment, water flows into secondary clarifiers where remaining biomass settles. Part of this settled sludge is recycled back to the aeration tank, and excess sludge is sent for further processing.
- Tertiary Treatment and Disinfection: Depending on reuse or discharge requirements, tertiary treatment may include filtration, nutrient removal, or advanced processes like UV or chlorination. A diagram of a sewage treatment plant that includes tertiary treatment usually shows these units at the end, indicating final polishing of water.
UNS Global continues to offer reliable wastewater treatment solutions by combining advanced technology with easy-to-understand visual explanations. Through thoughtful design and human-centered communication, our company helps clients see not just the system, but the logic behind every drop of treated water. With well-designed diagrams, plant efficiency improves, communication becomes easier, and environmental goals are met effectively.